A More Interesting Retry
I’ve been playing with writing my own Typescript / WebGL 3d game engine from scratch and fumbling about with machine learning (which oddly have a lot in common). The hobby has led me to studying linear algebra, which has got me looking at lots of problems in a different light. I blame a lot of my recent thinking on the YouTube Channel 3 Brown 1 Blue. The author of that channel lays out maths in a very visual way - it is much to my liking. The way he explains things has really re-sparked my interest in mathematics.
I’d like to give an example of how thinking of things visually makes problems “jump off the page” for me.
Let say you’re writing some code that is going to do an HTTP request. The server is unreliable so you want to try to do the call a few times before giving up. Let’s say you come across the following solution:
let times = 1;       // counter variable
const max = 10;      // max number of retry attempts
const scale = 1000;  // number of milliseconds

let timeoffset = scale;
const step = () => {
	console.log(timeoffset);

	if(times < max) {
		// do our stuff
		times++;
		setTimeout(step, timeoffset);
	}
};
setTimeout(step, timeoffset);
Leaving aside any standard complaints about setTimeout etc, this make sense. It loops around 10 times and does it’s thing every scale milliseconds.
What would this look like if we graphed it?
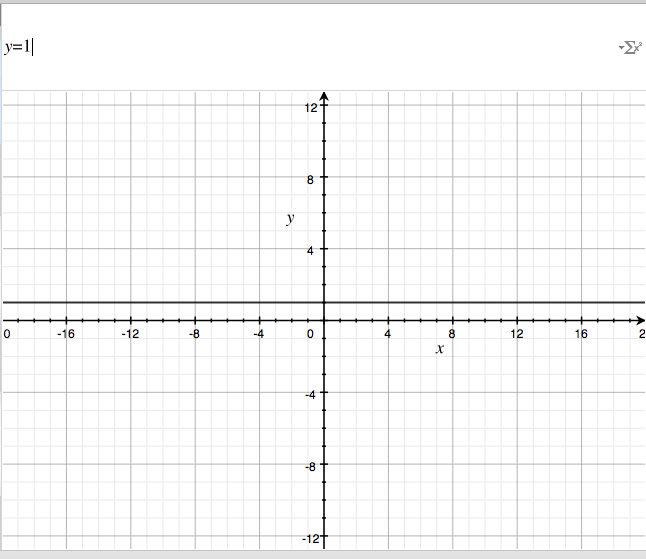
Let the X axis be time moving forward, and the Y axis be the request time in milliseconds. So as time moves forward along the X axis {1,2,3…}, the request time always fires off at 1 second.
Well, what if we want to do something more interesting. What if we wanted to make the requests frequently, and then slow them down to give the server a break?
Let’s do something easier first. What happens when we do this:
let times = 1;       // counter variable
const max = 10;      // max number of retry attempts
const scale = 1000;  // number of milliseconds

const linear = t => t;                                     // y = x

let timeoffset = scale;
const step = () => {
	timeoffset = linear(times) * scale;

	console.log(timeoffset);

	if(times < max) {
		// do our stuff
		times++;
		setTimeout(step, timeoffset);
	}
};
setTimeout(step, timeoffset);
You’re probably familiar with this kind of graph. This is linear - rise over run, mx+b… Looking at the graph this makes, you can easily see what it does:
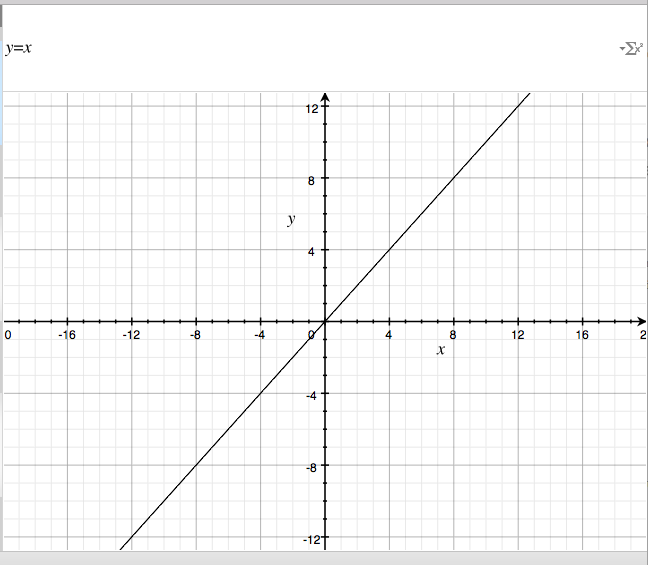
As time moves forward along the X axis, the amount of time between requests follows the same path. So at the first step it will take one second, and the second step two seconds, etc.
Where I think this gets cool is when the connection is made: “Ok, so if I want the code to behave differently, I just need to make this graph behave differently.”
What happens when we throw a natural log at it?
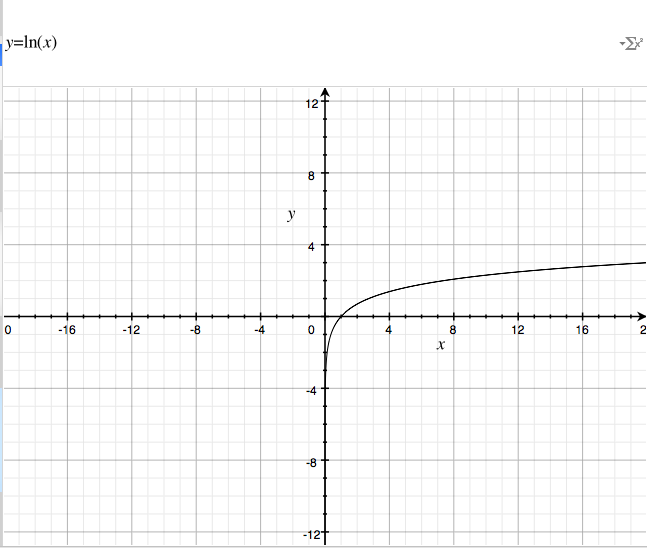
How cool is that? We can retry a bunch of times starting out kind of fast, but then slowly increasing the time between requests!
let times = 1;       // counter variable
const max = 10;      // max number of retry attempts
const scale = 1000;  // number of milliseconds

const logE = t => Math.log(t);                             // natural log

let timeoffset = scale;
const step = () => {
	timeoffset = logE(times) * scale;

	console.log(timeoffset);

	if(times < max) {
		// do our stuff
		times++;
		setTimeout(step, timeoffset);
	}
};
setTimeout(step, timeoffset);
Yields
0
693.1471805599453
1098.6122886681096
1386.2943611198906
1609.4379124341003
1791.759469228055
1945.9101490553132
2079.4415416798357
2197.2245773362196
2302.585092994046
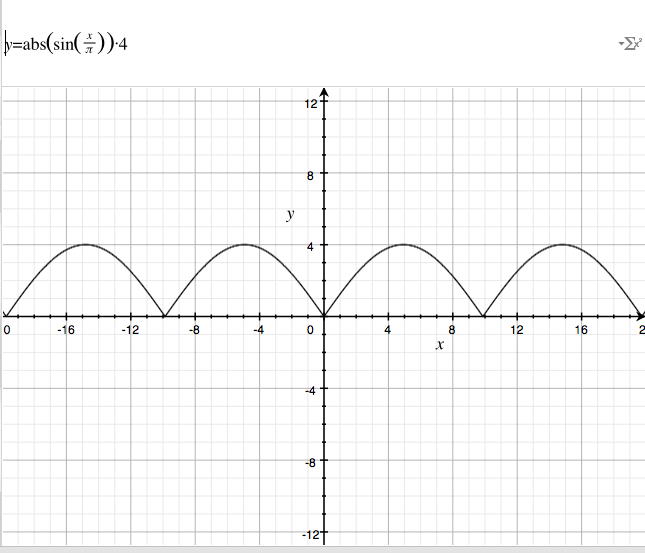
There is no end to this madness. What if you want to do something that starts out fast, slows down, then goes fast again?
let times = 1;       // counter variable
const max = 10;      // max number of retry attempts
const scale = 1000;  // number of milliseconds

const sinPie = t => Math.abs((Math.sin(t / Math.PI) * 4)); // sin

let timeoffset = scale;
const step = () => {
	timeoffset = sinPie(times) * scale;

	console.log(timeoffset);

	if(times < max) {
		// do our stuff
		times++;
		setTimeout(step, timeoffset);
	}
};
setTimeout(step, timeoffset);
Yields
1251.8471848311465
2377.9230740992884
3265.0924343576853
3824.222629310518
3999.138648253825
3772.2669290277895
3166.400948663325
2242.4111953568563
1093.129597612475
165.9771667943476
This is borderline magic to me. I am having a lot of fun thinking about problems this way. Thinking visually (and writing my own matrix library from scratch) has had interesting effects on how I’ve been writing code lately.
If you find this way of working interesting, I highly recommend that YouTube channel 3 Brown 1 Blue, and watching the Stanford course on machine learning by Andrew Ng - it’s fun.